Ice caps and still sea ice

Photo: Robert Thorpe

State of the Arctic

By Dr. Zachary Labe

MINS


06 Jul 2021

It’s that time of year again. Another summer melt season is well underway. In a typical year, Arctic sea-ice extent follows the shape of a seasonal cycle. In other words, it grows during winter and melts in the summer until it reaches an annual minimum extent in September. However, Arctic sea ice is shrinking faster than it is refreezing, both in terms of its thickness and extent.

This is not normal, and recent research suggests that the current rate of sea-ice loss is unprecedented for at least the last 1,500 years. While not every year can be a new record low due to natural variability, the effects of climate change are still very visible in this remote region of our planet.

June 2021 chart of Arctic sea ice

Daily Arctic sea-ice extent in 2021 (red line) compared to average (dark blue line). Data is from the NSIDC Sea Ice Index v3. “Ice-free” conditions are considered less than one million square kilometers.

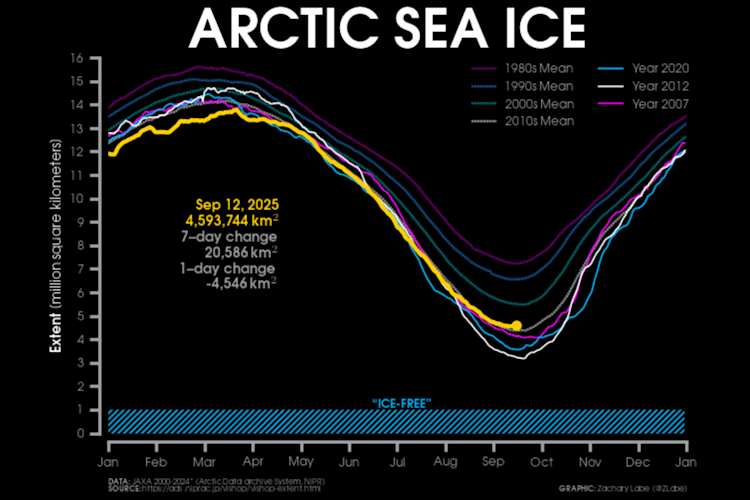
Last year observed the 2nd smallest extent of Arctic sea ice in the satellite history. This was accompanied by unprecedented warmth across Siberia that persisted for nearly every month of 2020. In fact, a recent study found the heatwaves over that region would have been nearly impossible without human-caused climate change.

Unusual fall

The massive area of open water north of Eurasia and abundantly sunny skies led to an increase in the absorption of heat in the upper layers of the Arctic Ocean by the end of last summer. The warm ocean and strange weather conditions further contributed to the latest sea-ice freeze-up on record in the Laptev Sea. At one point in October, the total extent of Arctic sea ice reached the largest absolute anomaly on record – more than 3,000,000 square kilometers below average or greater than the size of India!

As sea ice continued to slowly refreeze, all the heat that accumulated in the ocean during summer escaped into the overlying atmosphere. This led to the warmest November on record for the Arctic Circle. By the end of December, the sea ice had reemerged across most of the Siberian Arctic and finally bringing an end to the historic autumn freeze season.

Winter extremes

2021 started off with a remarkable change in weather conditions both at the surface and high in the atmosphere. A sudden stratospheric warming (SSW) event occurred in early January, which happens when the polar vortex dramatically weakens in the upper levels of the atmosphere over the Arctic. Although this spectacular meteorological event takes place high in the stratosphere, it can also have a significant influence on winter weather that directly impacts people across North America, Europe, and Asia.

So far, 2021 is no stranger to extreme events. As a result of the weaker polar vortex, record cold escaped into North America and contributed to the coldest February in more than 30 years across the contiguous United States.

Meanwhile, closer to the Arctic, unusual warmth continued across the Barents-Kara Seas with temperatures nearly 10°C (18°F) above average. And, after almost a year of record heat, colder temperature anomalies returned to the Siberian Arctic.

Interactions between the weaker polar vortex (stratosphere) and conditions in the troposphere (e.g., the jet stream) remained a significant driver of regional weather patterns through the end of winter. Although the late-winter warmth in the Arctic was certainly less extreme than recent years, the annual sea ice maximum still fell to the 9th lowest on record (March 2021).

Summer melt season

Despite colder temperatures returning to the Eurasian coast by mid-late winter, unusual atmospheric conditions in spring contributed to another record start to the melt season in the Laptev Sea. Average June 2021 sea-ice extent in the Laptev Sea was the smallest on record. Keep in mind that the previous record was set just last year! Recent research has found that excessive warmth in the deep ocean may also be enhancing ice loss in this region, but this remains an active area of research.

Chart of Laptev Sea, June 2021

Average June Arctic sea-ice extent in the Laptev Sea for each year from 1979 to 2021. Data is from the NSIDC Sea Ice Index v3.

Across the rest of the Arctic, sea-ice extent remains well below average as we begin July. The volume of ice also remains consistent with the long-term declining trend and nearly 25% below average as of May 2021.

Chart of Arctic sea ice 1979-2021

Daily Arctic sea-ice volume simulated for each year from 1979 [blue line] to 2020 [red line]. 2021 is shown in yellow. Data is from the Pan-Arctic Ice Ocean Modeling and Assimilation System (PIOMAS v2.1).

Forecasts for the annual minimum extent in September suggest that a new record low is unlikely this year. This is consistent with recent projections by numerical weather models that show cloudier and cooler weather in the Central Arctic compared to some recent years (less melt momentum). In addition, the latest maps of sea-ice age show a large fragment of multi-year ice in the Beaufort Sea (north of Alaska), which is probably unlikely to disappear this summer. Regardless, we just need to wait and see how the weather unfolds for the rest of the summer.

Far-reaching impact

Overall, the extraordinary transformation of the Arctic continues because of human-caused climate change. Although this year may not be another record data point, regional changes in the Arctic (such across the Laptev Sea) continue to have far-reaching effects on society and marine/terrestrial ecosystems. Without a reduction in our greenhouse gas emissions, state-of-the-art climate models continue to indicate a long-term decrease in sea-ice thickness and the first “ice-free” summer by sometime in the middle of the 21st century.

The Arctic is also projected to warm at a rate of more than three times as fast as the global average, which may affect future weather patterns within the Arctic and beyond. As the number of ice-free days continue to lengthen, polar bear habitats will increasingly become at risk, and climate models show that their survivability will become strained without a reduction in fossil fuels.

Temperature anomaly chart

Maps of surface air temperature departures averaged for each year from 1900 to 2020 across the Arctic Circle. Data is from the Berkeley Earth Surface Temperature project.

Climate change and its regional extremes are already impacting the cultural identity and way of life for indigenous communities along the shores of the Arctic. As a climate scientist, I continue to be alarmed by the number of extreme events occurring around the Arctic, but I believe that we can still make a difference to avoid the worst of its effects. 

Dr. Zachary Labe is a postdoctoral researcher in the Department of Atmospheric Science at Colorado State University. Follow hlm on Twitter (@ZLabe) or visit his website. All graphics by Dr. Zachary Labe.