

“The only constant in life is change.” While this saying is old, perhaps never has it been so apt as in the current age of rapid human-made climate change. With every passing year of collecting weather data, we climate scientists should be recording fewer and fewer weather surprises, just as we gather life experience with age. Yet in recent years we have seen one unprecedented weather or climate event after the other.
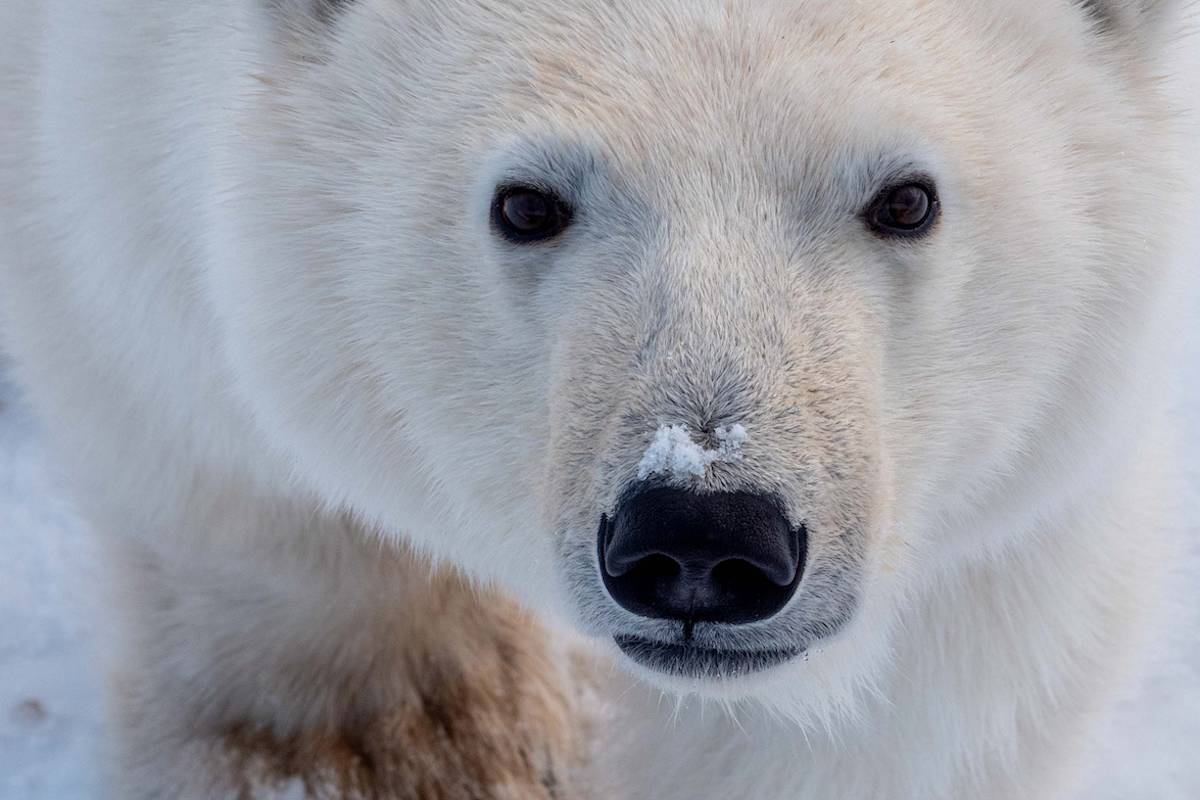
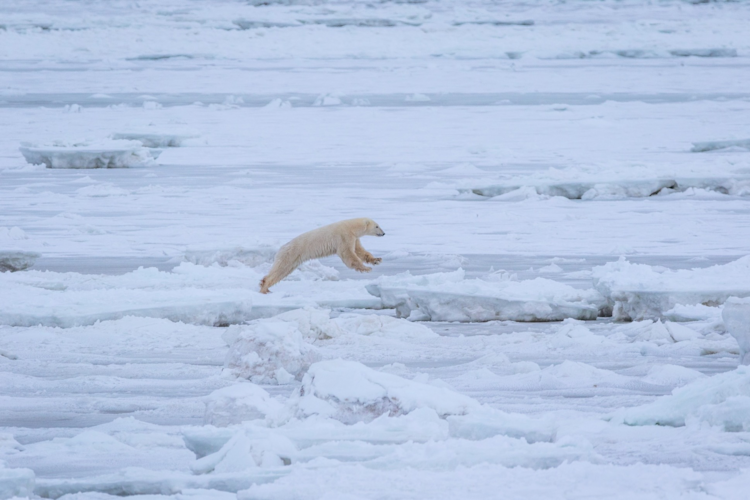
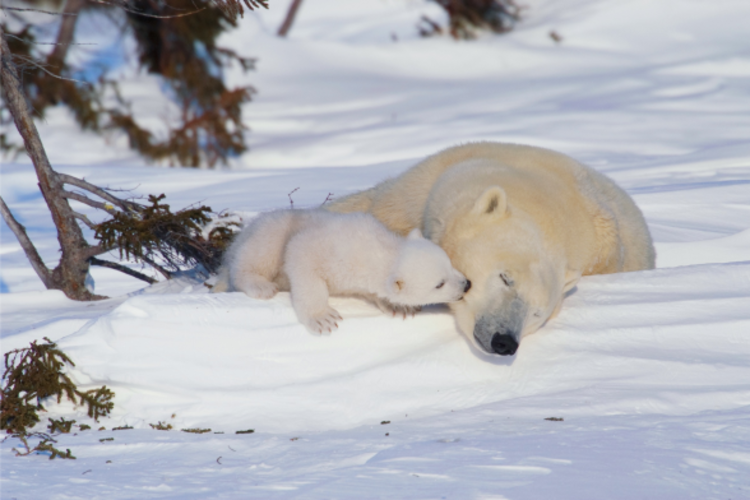
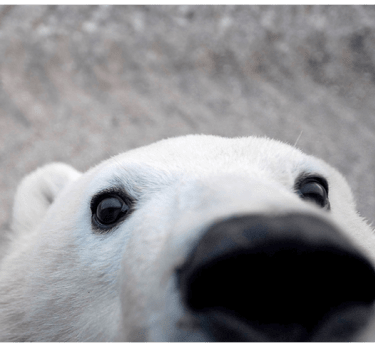
Photo: Kieran McIver / Polar Bears International
From Wildfire Smoke in New York to Polar Bears in Hudson Bay
How climate change affects our weather and its impacts. By Dr. Flavio Lehner
MINS
27 Jun 2023
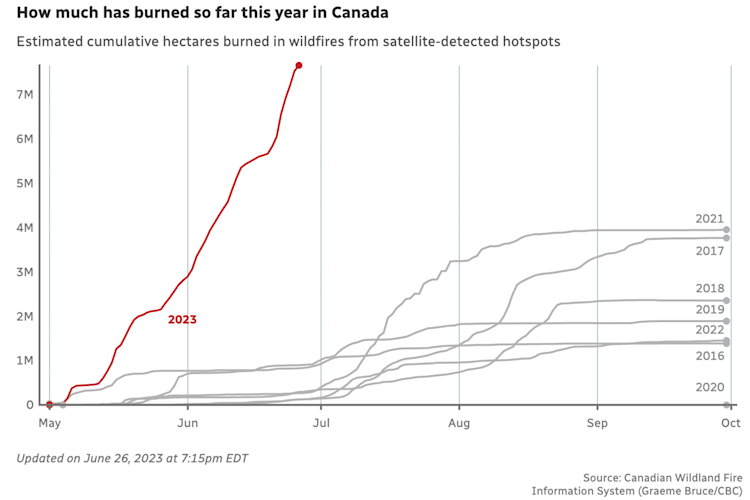
Photo: Source: Canadian Wildland Fire Information System (Graeme Bruce/CBC)
Figure 1: Canadian wildfires. Cumulative area burned as a function of calendar month for recent years. The year 2023 (red) stands out against previous wildfire years (gray).
This year is no different. May 2023 saw an explosion of wildfires in several parts of Canada, burning, within a few weeks, as much land as would normally burn in a year (Figure 1). Notably, this happened well ahead of the main fire season, which historically is in July and August. In late May and early June, winds transported the smoke from these wildfires across large swaths of North America, including the densely populated East Coast of the United States. When the smoke hit New York City and surrounding areas around June 7, it created hazardous air quality conditions for over 100 million people. In fact, it was the largest population exposure to wildfire smoke in recorded U.S. history, even edging out the famous West Coast fire season of 2020, which choked Washington, Oregon, and California.
As so often with extreme weather and climate events, there are multiple reasons for their occurrence—just as there are multiple impacts. While the Canadian wildfires were started by a mix of naturally occurring lightning and human ignition, they would not have grown to their size if it were not for the ideal conditions from which they started. For most of May and well into June, a high pressure system was parked over Canada, leading to sunny, warm, and dry conditions, “priming” the landscape for an explosive start to the fire season. In fact, in May temperatures were over 4°C warmer than normal (1951-1980 baseline) and breaking previous records over almost half of Canada (Figure 2).
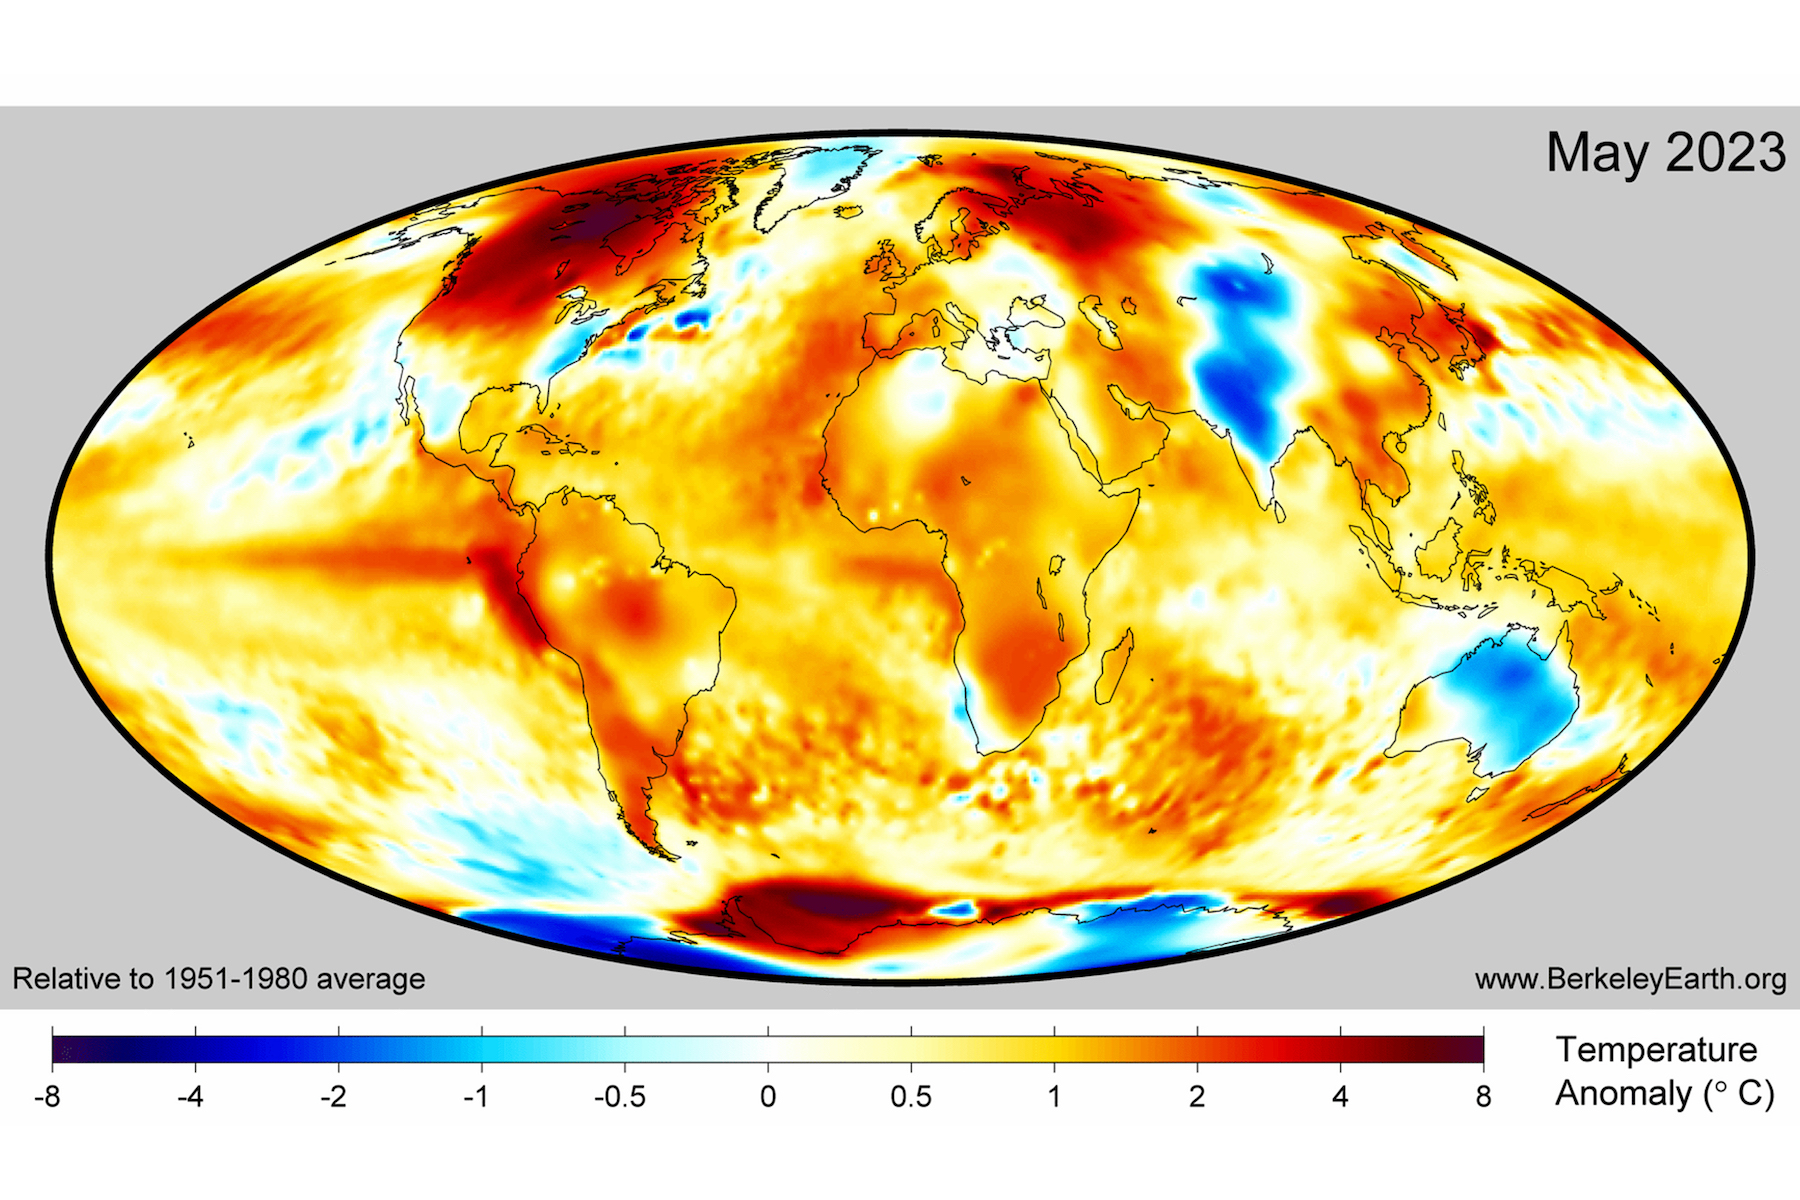
Photo: Berkeley Earth
Figure 2: Heatwave over Canada. (Top) May 2023 average temperature deviation from the baseline (1951-1980 average May temperature) in the Berkeley Earth dataset. (Bottom) Rank of May 2023 temperatures; dark red marks areas where 2023 was the warmest May on record.
North America is no stranger to so-called blocking high pressure systems, sometimes called “heat domes” in popular writing. The devastating heatwave in Western Canada in June 2021, for example, also resulted from that type of weather pattern. At the time, Canadian all time high temperature records were shattered, with hundreds of heat-related fatalities in the region. Research found that while such weather patterns are not unheard of in this region, climate change has made them significantly more potent. In other words, while climate change does not cause these events, it makes them more extreme whenever they occur. The classic analogy of a baseball player on steroids rings true: The player was always going to hit the ball, but when he hits it on steroids, he hits it harder.
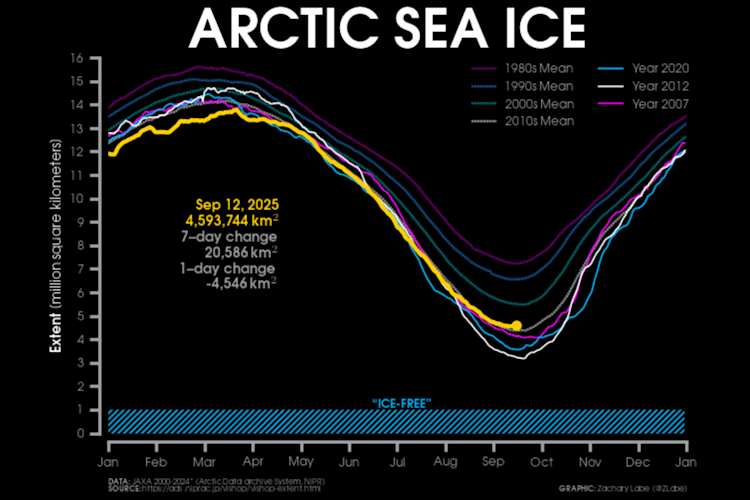
The same heat that fueled the Canadian wildfires this year was also detrimental to the sea ice in Hudson Bay, especially its Western sector. Excessive warmth melted the ice and led to a rapid decline in sea ice area. By June 17, 2023, the sea ice extent in Western Hudson Bay had plummeted to below 30%, according to preliminary data by the National Snow and Ice Data Center (the official break-up date from Environment and Climate Change Canada has not yet been determined). This threshold is used by Polar Bears International and other organizations to track the sea ice break-up date in Western Hudson Bay over the years. Research has shown that polar bears start to abandon sea ice at those low concentrations and swim to land. An early sea ice break-up date is thus highly consequential for polar bears. Spring and early summer are the prime seal-hunting time and the longer the bears can stay on the ice, the more fat reserves they can accumulate. Once they are on land for the summer, they will lose about 1kg/2.2lbs of body weight per day as there is nothing of substance for them to eat.
This year’s break-up date of June 17 is the 3rd earliest in the 45 years of satellite-based sea ice data from Western Hudson Bay, after 2015 and 2003 (Figure 3). It follows a clear long-term trend towards earlier and earlier break-up dates. At the same time, the freeze-up date in fall has been getting later and later as well. Taken together, Western Hudson Bay’s ice-free season has lengthened at a rate of 7 days per decade and is now a full month longer than in the early 1980s. That means bears spend more time on land without food—they are fasting—with negative impacts on the bears’ ability to ensure survival of their offspring.
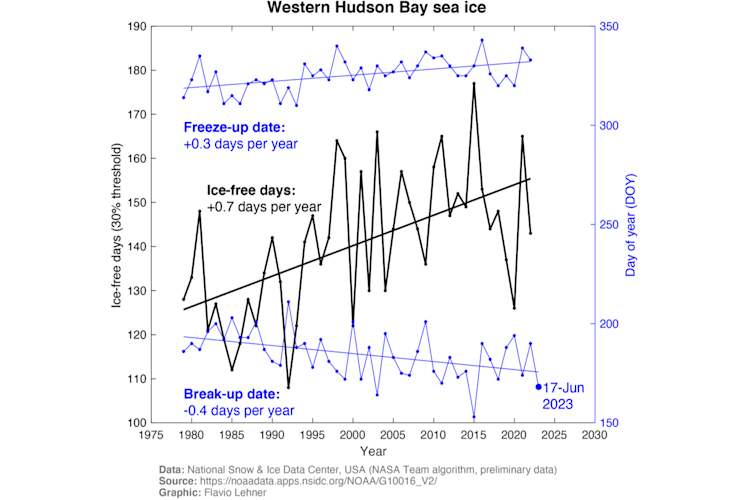
Figure 3: Sea ice trends in Western Hudson Bay. The number of ice-free days per year and their long-term trend (black line), calculated as the number of days between the break-up and freeze-up dates (blue lines). Break-up and freeze-up are defined as 30% of the domain seeing 30% sea ice concentration. The ice-free season has lengthened by about one month since the early 1980s, both due to earlier break-up and later freeze-up dates.
New research on both bear physiology and sea ice projections sends clear warning signals in this regard. First, biologists found that a fasting season in excess of 180 days threatens the sustainability of a bear population. With the current trends towards a longer ice-free season shown above, it is only a matter of time before 180 ice-free days occur regularly (2015, for example, already saw 177 ice-free days in Western Hudson Bay). Second, in two new studies, climate scientists have revised their latest projections of how rapidly sea ice will melt in response to future warming and found that the bulk of climate models slightly underestimate the rate of future ice loss. Correcting for this bias in model projections results in a more dire outlook for sea ice, with a chance for an ice-free Arctic even under future scenarios with only little additional warming over today.
Taken together, these latest data points emphasize again that action to halt emissions of heat-trapping greenhouse gasses from burning fossil fuels is urgently needed, as every tenth of a degree of warming matters for an ecosystem so sensitive to climate change as the Arctic sea ice.
Dr. Flavio Lehner is chief climate scientist at Polar Bears International and an associate professor in Earth and Atmospheric Sciences at Cornell University.