Aerial view of a frozen landscape in Svalbard, Norway

Photo: Kt Miller / Polar Bears International

State of the Arctic 2022

By Dr. Zachary Labe

MINS


07 Jul 2022

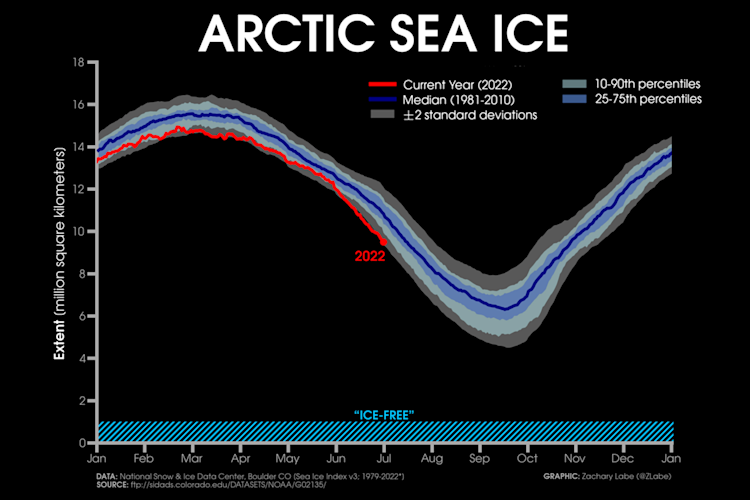
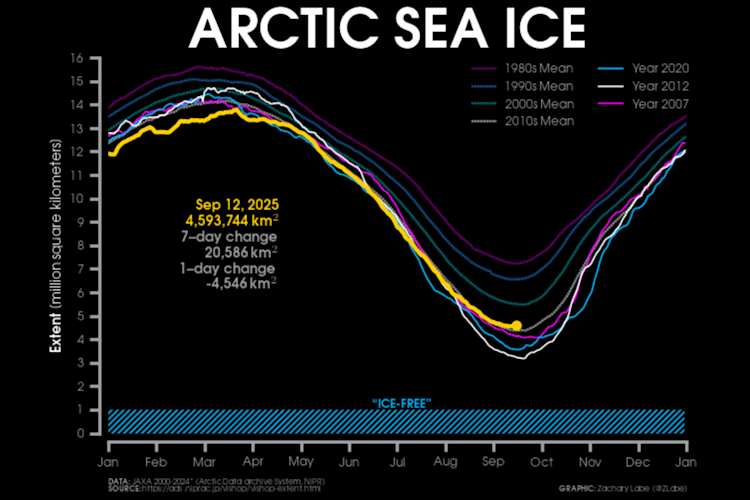
The amount of Arctic sea ice naturally varies throughout the year in a shape resembling a seasonal cycle (Figure 1). In other words, the maximum extent of Arctic sea ice is usually reached sometime in March, and the annual minimum extent is usually set in September. However, due to human-caused climate change, we are witnessing large changes in this natural cycle of Arctic sea ice growth and melt. In fact, the thickness of Arctic sea ice in some regions has thinned by nearly 2 meters (or 66%) since the middle of the 20th century. Meanwhile, the extent of Arctic sea ice during September is declining at a rate of 13% per decade—or approximately shrinking by the size of the state of South Carolina! While long-term declines in Arctic sea ice are now found in every month of the year, the largest drops have been during the late summer months.

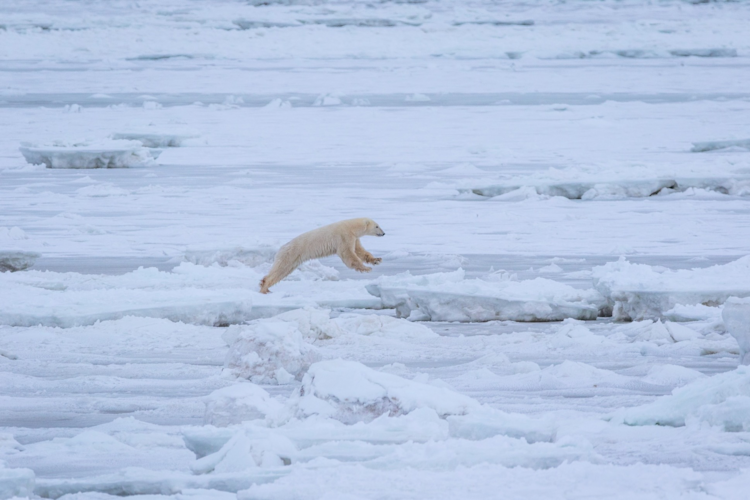
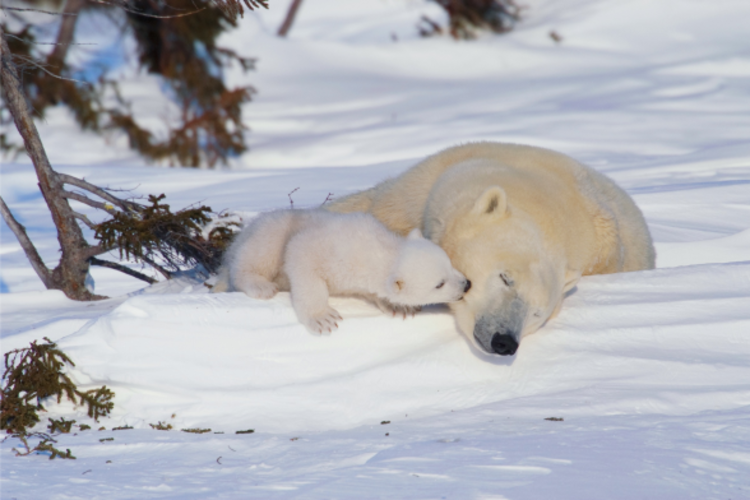
Therefore, monitoring the annual summer melt of Arctic sea ice is particularly important for evaluating these long-term trends. As expected, 2022 is no exception to the recent string of low sea ice years. As figure 1 shows, every day this year (red line) has witnessed sea ice below the long-term average (blue line). As of early July, Arctic sea ice levels are nearly two standard deviations below average this summer. This has significant consequences for the entire environment of the Arctic, including changes to the regional habitats for polar bear populations.

Daily Arctic sea-ice extent in 2022 compared to average

Photo: Dr. Zachary Labe

Figure 1: Daily Arctic sea-ice extent in 2022 (red line) compared to average (dark blue line). “Ice-free” conditions are considered less than one million square kilometers. Data is from the NSIDC Sea Ice Index v3.

No new records yet in 2022

Although the long-term trends are clear in the Arctic—such as declining Arctic sea ice, warming ocean and atmospheric temperatures, melting glaciers, thawing permafrost, shifts in plant phenology and Arctic greening—there is also large year-to-year variability. This means that not every year will observe a new record. An excellent blog by Dr. Ed Hawkins described this type of sea-ice variability as analogous to that of a bouncing ball rolling down a hill. While the downward movement of the ball is inevitable, there are still periods of upwards bounces.

In the real-world, this variability is tied to the chaotic nature of our atmosphere (often called “internal variability” and similar to the concept of the butterfly effect). This characteristic is well simulated by our climate models and is considered when analyzing future climate change projections. This is one reason that it is nearly impossible to predict the exact timing of our first ice-free Arctic summer. So far, 2022 fits this example perfectly. While we’ve witnessed sea-ice levels consistent with the long-term declining trend, there have been no new monthly records yet this year.

Maps of surface air temperature departures averaged for May 2022 , March 2022 to May 2022 , and June 2021 to May 2022

Photo: Dr. Zachary Labe

Figure 2: Maps of surface air temperature departures averaged for May 2022 (left), March 2022 to May 2022 (center), and June 2021 to May 2022 (right). The red numbers show the average temperature anomaly over the Northern Hemisphere for each time period. Temperature anomalies are calculated by subtracting the actual temperature minus a 1981-2010 average. Data is from the European Centre for Medium-Range Weather Forecasts ERA5 reanalysis.

A cooler spring

Compared to some recent years, the last few months have observed fairly small temperature departures across the greater Arctic Ocean basin (Figure 2). Cooler temperatures have generally been found around northern Greenland and stretching to the North Pole, while anomalous warmth has been confined to the Siberian coastal region around the Kara and Laptev Seas. These patterns of warmer and colder temperatures are linked to the position and strength of the jet stream and regions of low sea-ice cover.

Averaging temperatures over the last 12 months helps to remove some of the monthly variability from changes in weather patterns and subsequently reveals the familiar pattern of only warmer departures across nearly the entire Northern Hemisphere (Figure 2-right).

Daily Arctic sea-ice extent for each year from 1979 to 2021

Photo: Dr. Zachary Labe

Figure 3: Daily Arctic sea-ice extent for each year from 1979 [blue line] to 2021 [white line] for the Hudson Bay region. 2022 is shown in red. Data is from the NSIDC Sea Ice Index v3.

Pattern changes in June

A shift in the overall orientation of the jet stream (i.e., weather pattern) over the last few weeks has led to a dramatic kickoff to the boreal summer season with a series of record heatwaves across many regions of North Hemisphere. This unusual heat has also moved into parts of the Arctic. Temperatures more than 5°C (9°F) above average occurred around the Hudson Bay in June, which contributed to a rapid decline of its sea-ice cover (Figure 3). The break-up of sea ice was especially extreme in the northeastern Hudson Bay, which may have impacted polar bear populations in the Davis Strait region.

Excessive warmth also occurred in June over Svalbard, Scandinavia, and Siberia with numerous temperature records being set in these areas. Last month was the hottest June ever recorded at Svalbard Airport! All of the heat and sunshine resulted in another near-record start to the sea ice break-up in the Laptev Sea, and more broadly, sea ice remains well below average on the Atlantic side of the Arctic Ocean.

Daily Arctic sea-ice volume simulated for each year from 1979 to 2021

Photo: Dr. Zachary Labe

Figure 4: Daily Arctic sea-ice volume simulated for each year from 1979 [blue line] to 2021 [red line]. 2022 is shown in yellow. Data is from the Pan-Arctic Ice Ocean Modeling and Assimilation System (PIOMAS v2.1).

Outlook for the rest of summer

Predicting the evolution of Arctic sea-ice cover, especially at the end of summer melt season, is critically important for a wide range of stakeholders. But the challenge to predict the annual minimum extent of Arctic sea ice is vast and difficult. In recent years, the National Science Foundation and the Arctic Research Consortium of the U.S have organized a community project called the “Sea Ice Prediction Network” to investigate this issue. Scientific teams from around the world submit forecasts based on models ranging in complexity from linear regression to advanced climate models in order to predict the evolution of summertime Arctic sea ice.

The latest predictions from this network of forecasts do not suggest a new record low this year for the annual sea ice minimum in September. However, weather forecast models indicate an acceleration of sea-ice melt conditions through at least mid-July over parts of the Canadian Arctic with temperatures rising to more than 15°C (27°F) above average. Satellite observations also confirm that melting is already well underway in the Beaufort Sea with large melt ponds visible overtop of the existing sea ice. The consequences of this warmer and drier weather are also being felt across surrounding land areas with extreme wildfires and poor air quality found in Alaska and northwestern Canada.

It will be important for scientists to monitor the evolution of this extreme event over the next few weeks and assess how it will impact sea ice in the Northwest Passage and for polar bear populations throughout the rest of the Canadian Arctic Archipelago.

Maps of surface air temperature trends for each month of the year across the Arctic Circle

Photo: Dr. Zachary Labe

Figure 5: Maps of surface air temperature trends for each month of the year across the Arctic Circle. Trends in temperature are calculated over the last four decades. Data is from the European Centre for Medium-Range Weather Forecasts ERA5 reanalysis.

Long-term trends in the Arctic

As I pointed out earlier, it’s important to remember that even though this is large year-to-year variability in sea-ice conditions and regional weather, there are massive changes unfolding in the Arctic. Comparing the last four decades of sea-ice volume reveals a remarkable shift in the state of the Arctic (Figure 4). Ice is now younger and thinner. Recent Arctic warming is particularly large during the late fall and winter, which relates to the release of heat that is absorbed in the upper ocean around the September sea ice minimum (Figure 5).

Without reducing greenhouse gas emissions, climate models indicate that even when sea ice forms during winter, it will be a lot thinner than in the past. This would have large ecological consequences and even affect socio-economic industries like through shipping and transportation. Future warming of the Arctic could be linked to changes in extreme weather, such as through shifts in the polar vortex and/or jet stream. A recent study also found that the survivability of many polar bear populations may be at risk without a large reduction in fossil fuel emissions and therefore a smaller amount of future warming within the Arctic.

You can find additional graphics showing these climate change trends on my website at https://sites.uci.edu/zlabe/arctic-sea-ice-figures/ along with daily sea ice monitoring updates available from the National Snow and Ice Data Center (NSIDC) at https://nsidc.org/data/seaice_index. As I write every year on this blog, I am a climate scientist, but I continue to be alarmed by the speed and number of far-reaching effects of climate change in the Arctic.

Dr. Zachary Labe is a postdoctoral research associate in the Atmospheric and Oceanic Sciences Program at Princeton University and at NOAA Geophysical Fluid Dynamics Laboratory (GFDL). Follow him on Twitter (@ZLabe) or visit his website. All graphics by Dr. Zachary Labe, and the views presented here only reflect his own.