Photo: Daniel J. Cox
Conservation Concerns
Learn about the threats polar bears face—including the biggest one of all: climate warming.
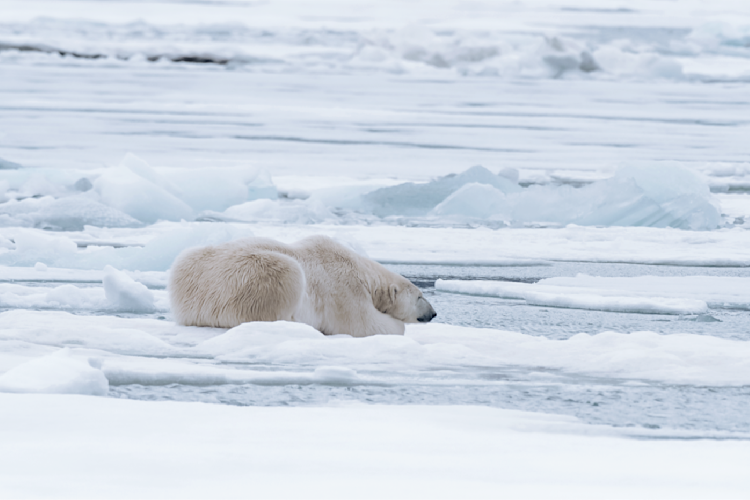
Photo: Daniel J. Cox
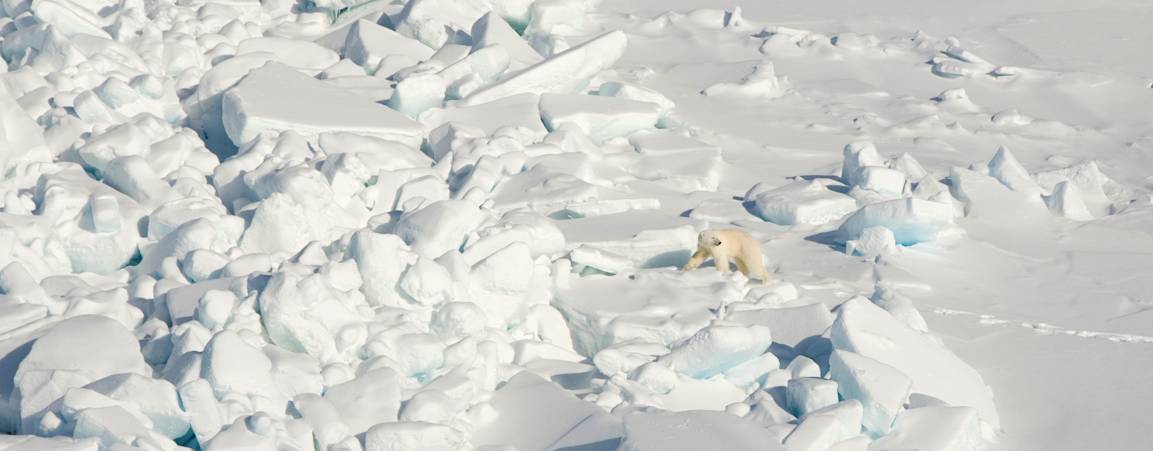
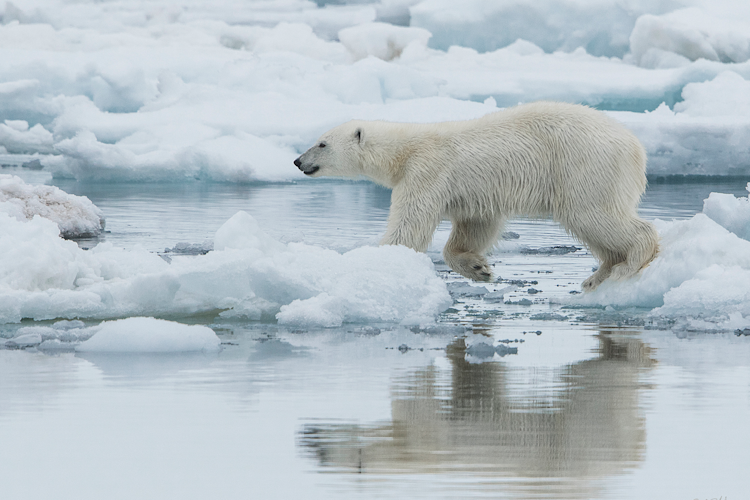
Climate Warming
Polar bears rely on sea ice to hunt, breed, roam, and sometimes to den. But the Arctic is warming and ice is melting due to human-caused climate change.
Already, in parts of the Arctic, longer ice-free seasons and longer fasting periods have led to a decline in some polar bear populations.
Research shows that without action to greatly reduce carbon emissions and stabilize our climate, we could lose all but a few polar bear populations by the end of the century.
Climate change calls for a new approach to conservation—we can’t build a fence around the polar bear’s melting habitat, and we can’t assign wildlife officers to guard the gate. The key to getting the climate back to functioning the way it should is to transition away from fossil fuels for energy altogether.
When will polar bear populations collapse? The answer is up to us.
A new study forecasts the future for polar bears based on two different emission scenarios.
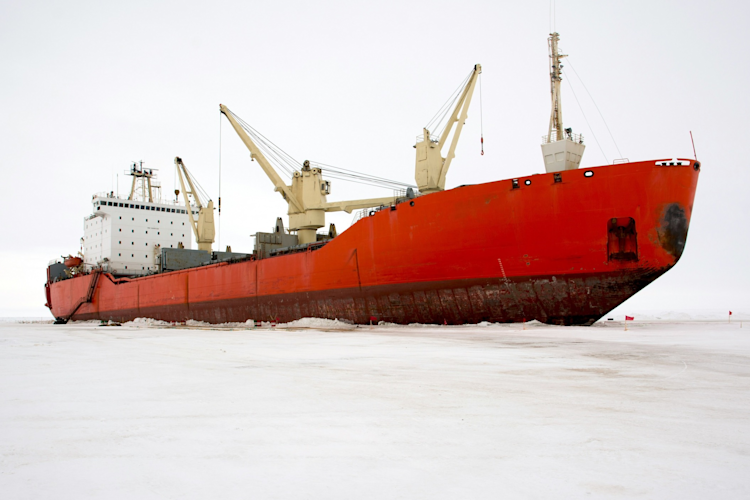
Photo: Dmitrii Tropinin / Unsplash.com
Commercial Activity
Commercial activity in the Arctic has increased as the region becomes more accessible. These activities include oil and gas exploration and development, shipping, mining, and tourism—each with their own challenges.
Oil and gas activity, for example, not only brings the risk of spills, but could disturb polar bear moms and cubs hidden in dens under the snow—the most vulnerable time in their life cycle.
Working to shield polar bears from disturbances will require vigilance and careful management.
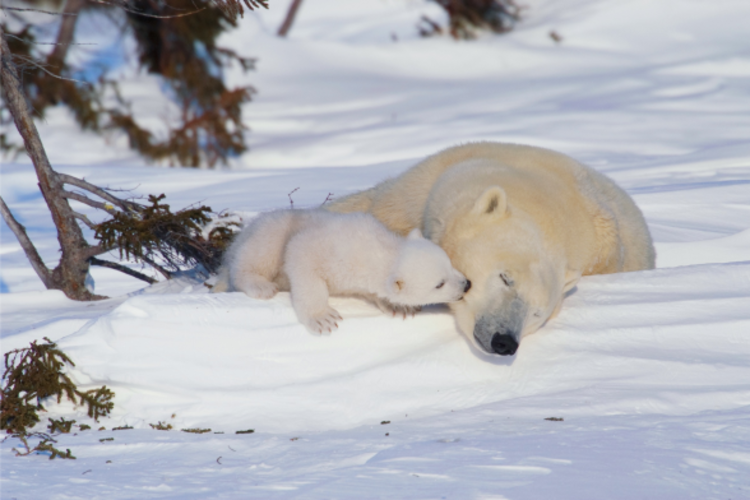
Protecting Dens Means Protecting Cubs
Denning is the most vulnerable time in a polar bear’s life. And in a warming Arctic, where polar bears face enormous challenges, the survival of every single cub is critically important.
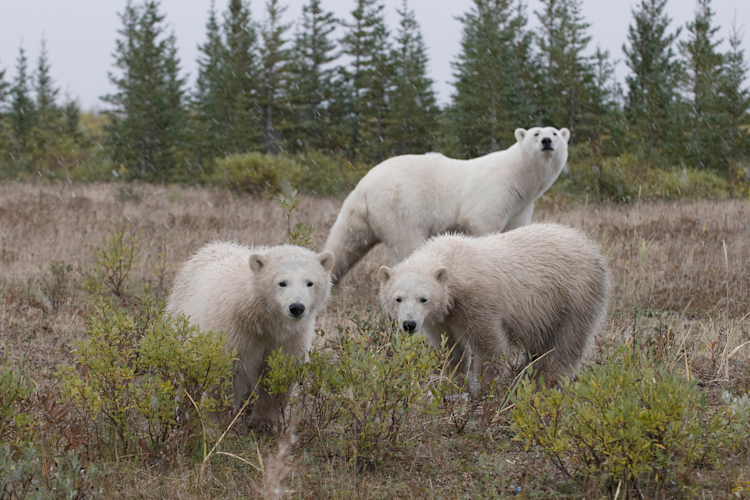
Photo: Daniel J. Cox
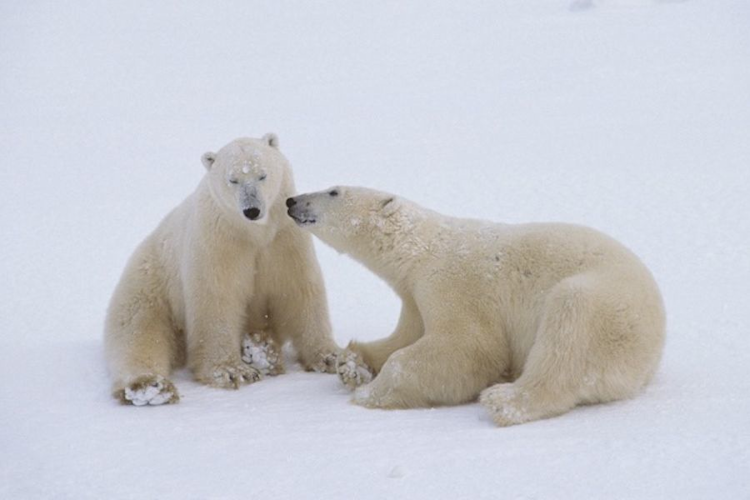
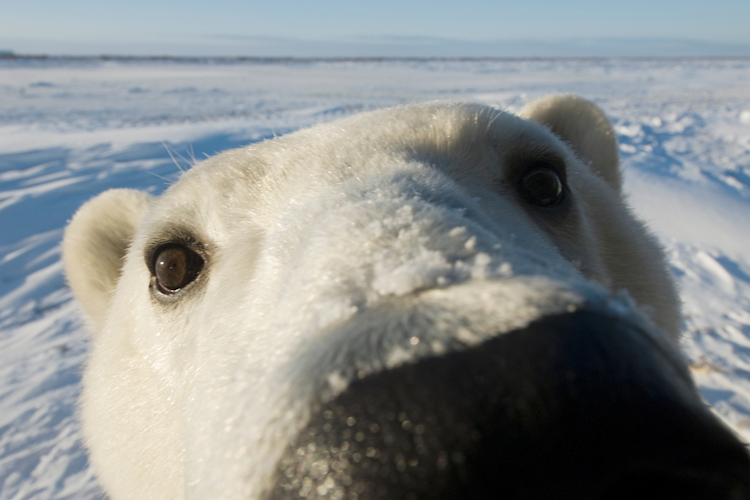
Conflicts & Encounters
As the sea ice melts and more polar bears spend more time on shore, and for longer periods, conflicts between polar bears and people are expected to increase.
Indeed, many coastal villages are already experiencing an uptick in encounters with polar bears, sometimes with tragic results.
Working proactively with communities to support their efforts to live safely with polar bears is an important—and growing—part of our work.
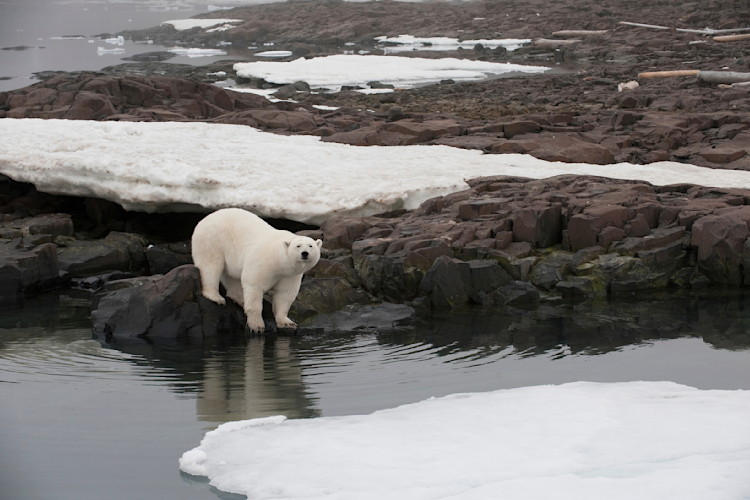
Photo: Daniel J. Cox
Pollution
The polar bear’s natural environment may seem white and pristine—far removed from the pollution in major cities and industrial areas.
But in reality, polar bears in some parts of the Arctic can carry surprisingly high loads of toxic chemicals.
Why? Because wind and ocean currents transport these pollutants to parts of the Arctic, where they concentrate as they make their way up the food chain. Polar bears absorb these higher levels when they eat seals.
Reducing these pollutants will not only help polar bears, but people, too.
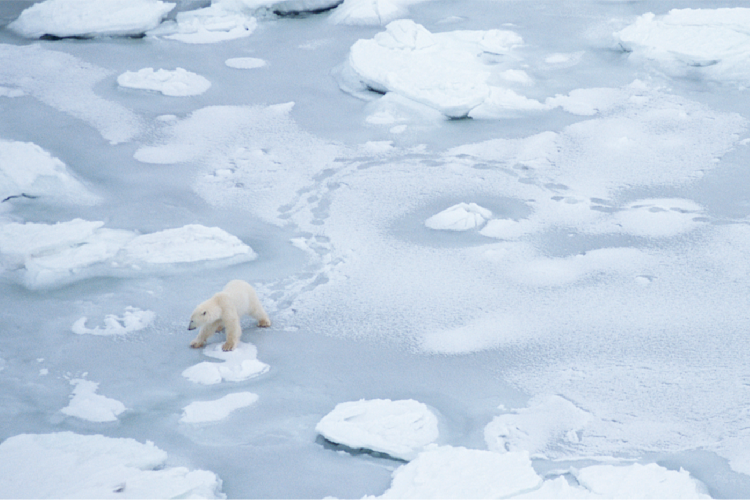
Photo: Daniel J. Cox
Disease
Like most bear species, polar bears are not very prone to disease, although some parasites, like Trichinella, and some viruses are known to have infected the bears.
The big concern for scientists is that more diseases will be introduced as the Arctic warms, due to increased human activity and the migration of lower-latitude species to the Far North.
A recent study of Chukchi Sea polar bears, which live in an area that has experienced massive sea ice loss, suggests they are being exposed to more pathogens (bacteria, viruses, and parasites) than previously. Earlier studies in Western Hudson Bay and the Southern Beaufort Sea identified increased pathogen exposure in these bears, too.
Photo: Daniel J. Cox
Overharvesting
In the past, unregulated commercial and sport hunting posed the gravest threat to the polar bear’s future. That challenge was eased thanks to an international agreement and careful management.
Today, legal harvests based on quota systems that allow populations to regenerate continue on a limited basis for Indigenous peoples. These hunts have long been an important part of cultural traditions and provide important nutritional benefits in some regions.
Ensuring that these limited hunts remain sustainable requires vigilance. Currently there is concern about a change in Nunavut, Canada, from a 2:1 male-female ratio to 1:1, which is potentially not sustainable. Members of the IUCN Polar Bear Specialist Group are in dialogue with members of the Polar Bear Range States – the management body for polar bears – on the urgent need for Nunavut to address this. The outcome could have a huge impact, as two-thirds of the world’s polar bears live in Nunavut or are shared with adjacent provinces or nations.
Unregulated or Poorly Regulated Tourism
Polar Bears International has long supported respectful tourism to see polar bears in their natural habitat. Seeing polar bears in the wild and learning about the challenges they face can inspire people to get involved in their conservation. But we must also ensure that the bears aren’t disturbed in a biologically meaningful way and that people and bears remain safe.
To better understand tourism impacts and make informed decisions on viewing guidelines, it’s important to measure the impact of disturbances on the bears. Such studies are challenging to set up and conduct, but increasingly important as tourism in the Arctic grows. We have started to do research in this area to answer basic questions.
While regulation is important, we also recognize that over-regulating can lead people to take a Wild West approach, encouraging them to skip places with strict guidelines in favor of places with lax rules or no rules at all. Data that answers questions related to tourism will provide wildlife managers with a basis for making informed decisions.
Latest News

Their future is in our hands
The International Union for Conservation of Nature (IUCN) classifies the polar bear as a vulnerable species. Given the nature and breadth of the threats polar bears face, it will take adaptive management today––coupled with aggressive action on climate change globally––for the species to survive in the long run.